There are no items in your cart
Add More
Add More
| Item Details | Price | ||
|---|---|---|---|

The essential guide to choosing the right statistical test for your data analysis.
March, 2025
"The purpose of statistics is not to describe the sample but to make inferences about the population." — Morris H. DeGroot
When faced with limited data but big questions, statisticians turn to hypothesis testing to draw meaningful conclusions. Among the most fundamental and frequently used statistical methods are Z-tests and T-tests. Though similar in purpose, their differences can significantly impact your analysis results. This guide will help you understand when to use each test, how they differ, and why the distinction matters in real-world data analysis scenarios.
| Feature | Z-Test | T-Test |
|---|---|---|
| Distribution | Normal (Z) distribution | Student's t-distribution |
| Population σ | Known | Unknown (estimated) |
| Sample size | Large (n ≥ 30) | Small or large |
| Sensitivity | Less sensitive to outliers | More sensitive to outliers |
| Typical use cases | Quality control, standardized tests | Scientific research, small studies |
The Z-test is a statistical procedure used to determine whether two population means are different when the variances are known and the sample size is large. Named after the standard normal distribution (Z-distribution), it's one of the most straightforward statistical tests.
Z = (x̄ - μ) / (σ / √n)
Where:
Manufacturing processes where standard deviations of measurements are well-established through historical data. For example, checking if a production batch meets specifications.
Educational assessments like SAT or GRE scores, where population parameters are known from extensive historical data and standardization.
Comparing hospital performance metrics against national standards where population parameters are established through comprehensive studies.
The T-test was developed by William Sealy Gosset (publishing under the pseudonym "Student") while working at Guinness Brewery. It addresses a practical limitation of the Z-test: the rarity of knowing the true population standard deviation in real-world scenarios.
t = (x̄ - μ) / (s / √n)
Where:
| Type | Purpose | Example Use Case |
|---|---|---|
| One-sample T-test | Compares a sample mean to a known or hypothesized population mean | Testing if mean customer satisfaction score differs from industry benchmark |
| Independent (Two-sample) T-test | Compares means from two unrelated groups | Comparing exam scores between two different classes |
| Paired T-test | Compares means from the same group at different times | Comparing before and after measurements in a drug trial |
| Welch's T-test | Two-sample test that doesn't assume equal variances | Comparing outcomes between groups with different variability |
The decision between using a Z-test or T-test hinges on several key factors. Making the wrong choice can lead to incorrect conclusions about your data. Here's what to consider:
When you have access to the true population standard deviation through historical data or standardized measurements.
When you must estimate the population standard deviation using your sample data (most real-world scenarios).
T-distribution accounts for the additional uncertainty with small samples by having heavier tails.
With large samples, t-distribution approaches normal distribution. Use T-test if σ unknown, Z-test if known.
Both tests assume normality, but T-test is more robust to minor violations with smaller samples.
Consider non-parametric alternatives like Wilcoxon or Mann-Whitney U tests if data is significantly skewed.
T-test is generally more conservative, making it harder to reject the null hypothesis—safer when uncertain.
When in doubt, the T-test is usually the safer choice for most real-world applications with sample data.
The fundamental difference between Z-tests and T-tests lies in their underlying distributions. The following visual comparison illustrates how T-distributions have heavier tails than the normal distribution, especially with smaller degrees of freedom (df).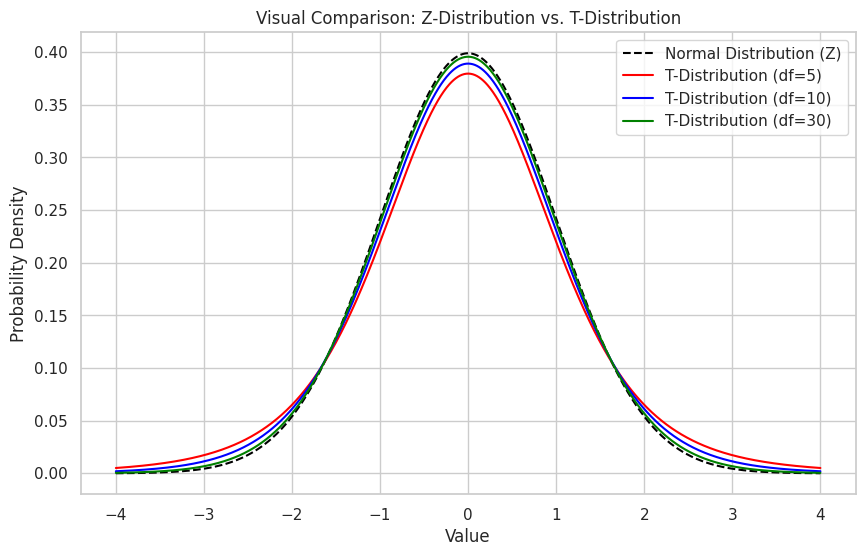
Note: The critical difference in these distributions explains why T-tests have larger critical values for rejecting null hypotheses compared to Z-tests with the same alpha level. This built-in conservatism compensates for the uncertainty in estimating the population standard deviation.
Substituting sample standard deviation into a Z-test formula without accounting for the additional uncertainty can lead to inflated Type I errors.
Both tests assume normality. With severely non-normal data, especially with small samples, results can be misleading.
Using a one-sample test when a two-sample test is appropriate (or vice versa) can lead to invalid conclusions about your data.
Focusing solely on statistical significance without considering effect sizes can lead to overemphasizing trivial differences in large samples.
Challenge yourself with these questions to ensure you understand when to use each test in practical scenarios.
Question 1:
A pharmaceutical company wants to test if a new drug reduces cholesterol levels. They have 15 patients and measure their cholesterol before and after treatment. Which test is most appropriate?
Answer: Paired t-test
Explanation: This is a before-and-after measurement on the same subjects (paired design) with a small sample size (n=15) and unknown population standard deviation. The paired t-test accounts for within-subject correlation and is appropriate for this design.
Question 2:
A quality control manager wants to verify if a production line is producing widgets with the correct weight. The target weight is 50g with a known standard deviation of 2g from years of production data. They randomly sample 40 widgets from today's production. Which test should they use?
Answer: Z-test
Explanation: This is an ideal scenario for a Z-test because: (1) The population standard deviation is known from historical data, (2) The sample size is large (n=40), and (3) They're testing if the sample mean differs from a known target value.
Question 3:
A researcher is comparing two teaching methods by examining test scores. Group A (n=25) was taught using Method A, and Group B (n=25) was taught using Method B. The researcher has no prior knowledge about the variability in test scores. Which test is appropriate?
Answer: Independent (Two-sample) T-test
Explanation: The researcher is comparing the means of two independent groups (Method A and Method B). Since the population standard deviation is unknown and sample sizes are less than 30, an independent t-test is appropriate to determine if there's a significant difference between the groups.
Question 4:
A pollster wants to determine if the average income in a city is different from the national average of $60,000. They sample 100 residents and find their average income to be $62,000. They know the population standard deviation of income from past census data is $10,000. Which test should they use?
Answer: Z-test
Explanation: The population standard deviation is known ($10,000) and the sample size is large (n=100). Therefore, a Z-test is appropriate to compare the sample mean to the national average.
Question 5:
A biologist is studying the growth rate of a rare plant species. They collect data from 10 plants and want to determine if their average growth rate is significantly different from 2 cm per week. They do not know the population standard deviation. Which test should they use?
Answer: One-sample T-test
Explanation: The researcher wants to compare the mean growth rate of a sample to a hypothesized population mean (2 cm). The population standard deviation is unknown, and the sample size is small (n=10). Therefore, a one-sample t-test is most suitable.
Question 6:
A marketing team wants to compare the effectiveness of two different ad campaigns. They randomly show Campaign A to 500 people and Campaign B to another 500 people, then measure their purchase intent on a scale of 1-10. They want to know if the average purchase intent is significantly different between the two groups. While they could estimate the population variance based on industry data, they're unsure how accurate it is. Which test is most appropriate?
Answer: Independent (Two-sample) T-test (or Welch's T-test)
Explanation: While the sample sizes are large (n=500 each), because they don't have *reliable* population standard deviation for purchase intent, the safer approach is the independent samples T-test. It's still better to use independent samples T-test. Although not required with such large samples, if they suspect variances might be unequal, Welch's t-test, which doesn't assume equal variances, would be even more appropriate.
 Launch your Graphy
Learn how to prepare for data science interviews with real questions, no shortcuts or fake promises.
See What’s Inside